|
|
ここまでスクリプトを段階的に準備してきましたが、これらをまとめると次のようになります。
TITLE 'Heat flow around an Insulating blob' VARIABLES Phi { the temperature } DEFINITIONS K = 1 { default conductivity } R = 0.5 { blob radius } EQUATIONS Div(-k*grad(phi)) = 0
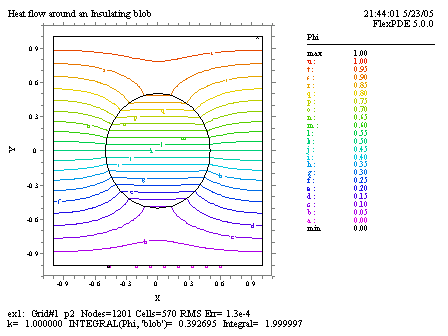
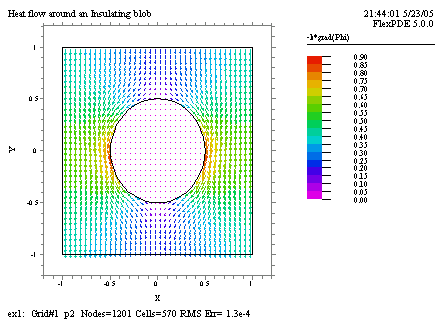
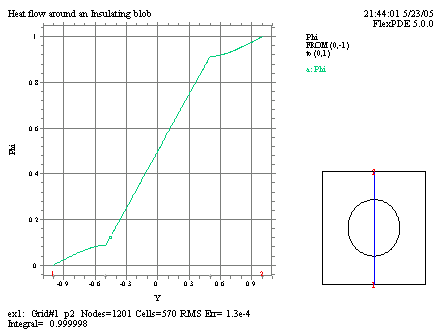
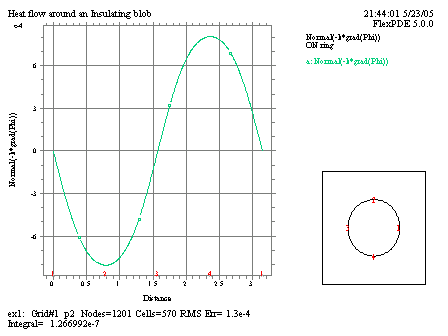
BOUNDARIES REGION 1 'box' START(-1,-1) VALUE(Phi)=0 LINE TO (1,-1) NATURAL(Phi)=0 LINE TO (1,1) VALUE(Phi)=1 LINE TO (-1,1) NATURAL(Phi)=0 LINE TO CLOSE REGION 2 'blob' { the embedded blob } k = 0.001 START 'ring' (R,0) ARC(CENTER=0,0) ANGLE=360 TO CLOSE PLOTS CONTOUR(Phi) VECTOR(-k*grad(Phi)) ELEVATION(Phi) FROM (0,-1) to (0,1) ELEVATION(Normal(-k*grad(Phi))) ON 'ring' END
この25行のスクリプトが問題を完全な形で記述しています。これをFlexPDEに実行させると次のようなグラフィックス出力を得ることができます。
|