
サンプルスクリプト
[5-1] 地下水の流れ解析 【Water.pde】
1. 概要
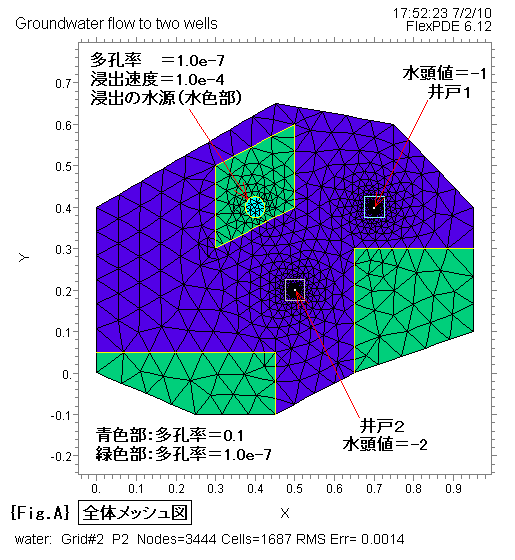
この問題は、異なる多孔率の土壌を通って、2つの井戸へ流れる水の流れを示します。 FlexPDEの能力を、大きく変化するメッシュ・サイズに特徴付けて表示します。
解析領域の外周境界は、圧力水頭を一定値『0』に保持します。
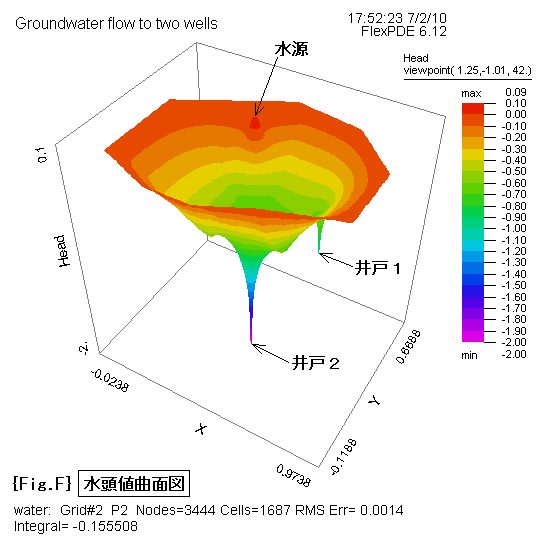
2つの井戸の水頭値は、それぞれ一定値『-1, -2』に保持します。
2. メッシュ図
{Fig.A}~{Fig.F} は、4項で対応するスクリプトを示します。
{Fig.A} に示します全体メッシュ図では、井戸1,2付近のメッシュが細分化されて、グリッド線で黒く塗りつぶされて見えます。
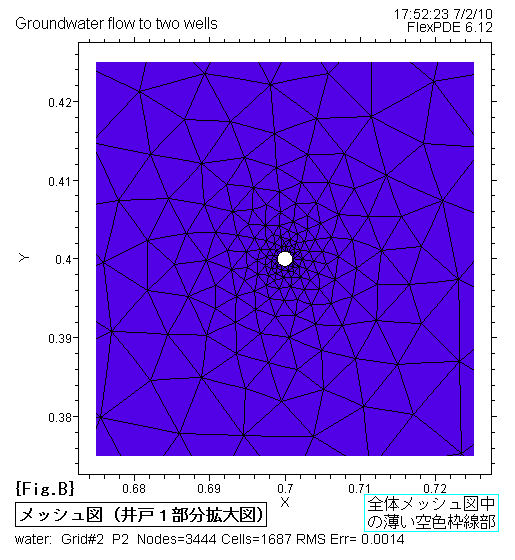
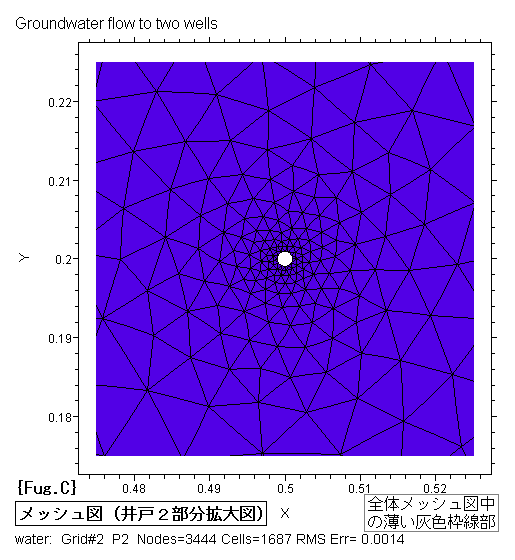
井戸1,2付近を拡大して、それぞれ {Fig.B},{Fig.C} に示します。
3. 解析結果
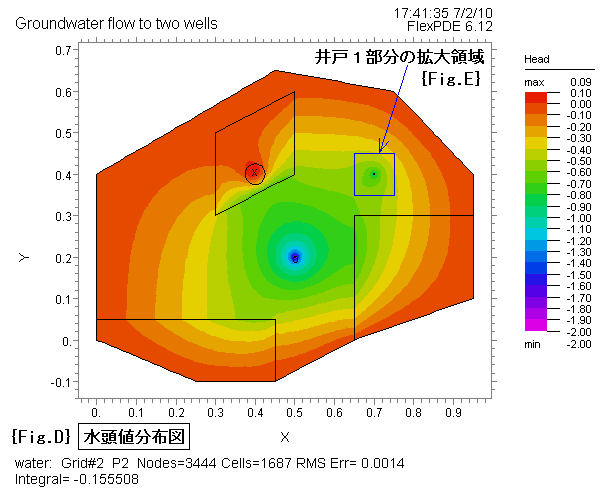
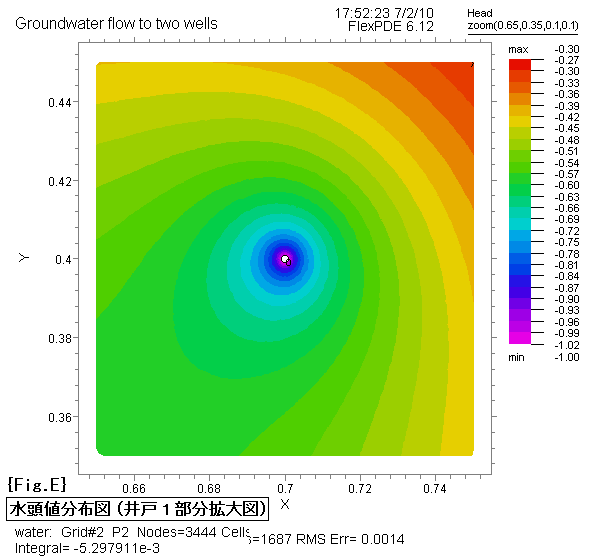
Fig.D}に水頭値を色分けした分布図を示します。 図中に青色枠線で示します井戸1付近の部分拡大図を{Fig.E}に示します。
水頭値をZ方向の高さで表した3D曲面図を{Fig.F}に示します。
4. スクリプト
下記のスクリプトをマウスでコピーし、FlexPDE エディット・ウィンドウに貼り付けて実行する際は、日本語のコメントを除去して下さい。そのままですと、コンパイル・エラーが発生する場合があります。
{  WATER.PDE

    This problem shows the flow of water to two wells, through soil regions of
    differing porosity.  It also displays the ability of FlexPDE to grid features
    of widely varying size.
}

title 'Groundwater flow to two wells'

definitions
    k                    { no value is required, as long as it appears later }
    s = 0                { no volumetric source }
    k1 = 0.1             { high porosity value 高多孔率値 }
    k2 = 1.0e-7          { low  porosity value 低多孔率値 }
    sx1 = 0.7   sy1 = 0.4{ well 1 location  井戸1の位置 }
    sx2 = 0.5   sy2 = 0.2{ well 2 location  井戸2の位置 }
    srad = 0.001         { well radius = one thousandth of domain size 井戸の半径 }
    w = 0.05             { a zoom window size }

    px = 0.4    py = 0.4 { percolation pond center 浸出水源の中心 }
    pr = 0.025           { percolation pond radius 浸出水源の半径 }
    ps = 1e-4            { percolation rate 浸出速度 }

variables
    h

equations
    h : div(k*grad(h)) + s = 0

boundaries

  region 1  { The domain boundary, held at constant pressure head }
    k=k1
    start(0,0)
    value(h)=0 line to (0.25,-0.1)
                    to (0.45,-0.1)
                    to (0.65,0)
                    to (0.95,0.1)
                    to (0.95,0.4)
                    to (0.75,0.6)
                    to (0.45,0.65)
                    to (0,0.4)
                    to close

    { Two wells, held at constant draw-down depths }
    start(sx1,sy1-srad)
    value(h) = -1        arc(center=sx1,sy1) angle=-360
    start(sx2,sy2-srad)
    value(h) = -2        arc(center=sx2,sy2) angle=-360

  region 2  { Some regions of low porosity }
    k=k2
    start(0,0) line to (0.25,-0.1)
                    to (0.45,-0.1)
                    to (0.45,0.05)
                    to (0,0.05)
                    to close

    start(0.95,0.1) line to (0.95,0.3)
                    to (0.65,0.3)
                    to (0.65,0)
                    to close

    start(0.3,0.3) line to (0.5,0.4)
                    to (0.5,0.6)
                    to (0.3,0.5)
                    to close

  region 3  { A percolation pond 浸出の水源 }
    k = k2
    s = ps  { percolation rate  浸出速度 }
    start (px,py-pr) arc(center=px,py) angle=360

monitors
  contour(h)

plots
  grid(x,y)				{ Fig.A }
  grid(x,y) zoom(sx1-w/2,sy1-w/2,w,w)	{ Fig.B }
  grid(x,y) zoom(sx2-w/2,sy2-w/2,w,w)	{ Fig.C }
  contour(h) as 'Head'	painted		{ Fig.D }
  contour(h) as 'Head' zoom(0.65,0.35,0.1,0.1) painted	{ Fig.E }
  surface(h) as 'Head'			{ Fig.F }

end